from west (St. Petersburg) to east (Tampa).
These were numbered, respectively, W 01
(Piers 1-W to 33-W), W 02 (Piers 34-W to
56-W), E 02 (Piers 56-E to 29-E) and E 01
(Piers 28-E to 1-E). The W 02 and E 02 sections
are separated by a navigation channel
at the middle of the bridge. For each of
the four bridge sections, the table tallies
the number of piles, their mean tip elevations,
and the SD and COV of the mean
elevations. These statistics are also partitioned
by group where:
Group I Piles terminating in the upper
hard limestone layer
HARTMAN
ENGINEERING 1.716.759.2800 | www.hartmanengineering.com
4910 Ransom Road, Clarence, NY 14031-2141
Our firm has many years experience taking on the challenges of difficult design problems in the
specialized area of cofferdams, retaining walls, foundation support, and damaged structures
• Pile Hammers - new / refurbished
• Custom Leads - all tubular, pinned style, boom point, fair
leads, fixed / swinging, onshore / offshore
• Accessories - drive caps, cushion material, air line oilers,
air hose, replacement parts
• Sales and rentals of pile driving equipment
• Repair and service of pile driving equipment
Phone: 706-398-1178
Fax: 706-398-1188
www.vulcanhammer.com
example, the westernmost section (i.e.,
Piers 1-W to 33-W) has the most punchthroughs,
with only 72% of the piles bearing
in their intended stratum; while the
eastern-most section from Piers 1-E to 28-E
has the fewest punch-throughs, with fully
99% of the piles bearing in their intended
stratum. These differences are reflected in
the population statistics and make for different
levels of risk for different sections of
a new structure built at the site. They are
also confirmed by an engineering geology
review of the boring records.
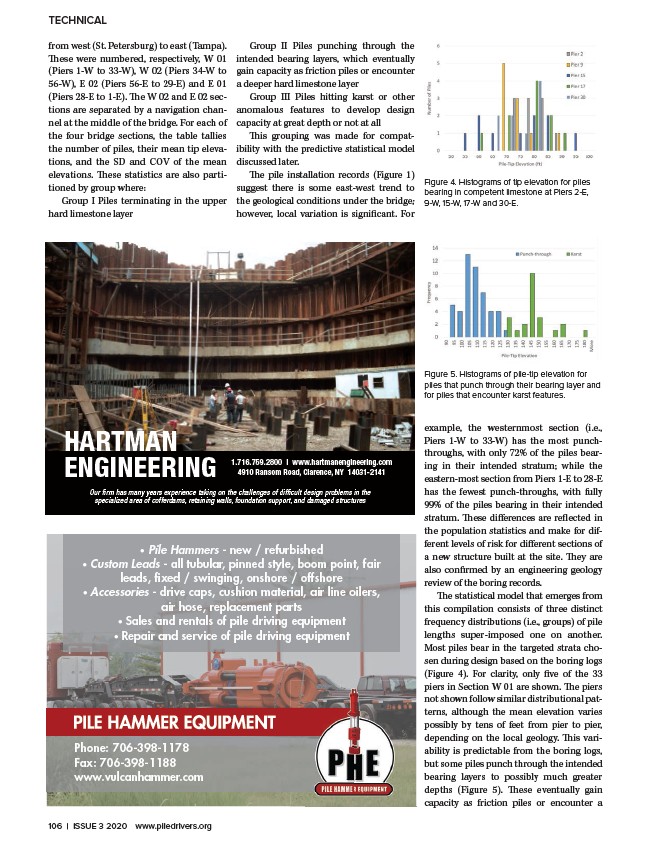
The statistical model that emerges from
this compilation consists of three distinct
frequency distributions (i.e., groups) of pile
lengths super-imposed one on another.
Most piles bear in the targeted strata chosen
during design based on the boring logs
(Figure 4). For clarity, only five of the 33
piers in Section W 01 are shown. The piers
not shown follow similar distributional patterns,
although the mean elevation varies
possibly by tens of feet from pier to pier,
depending on the local geology. This variability
is predictable from the boring logs,
but some piles punch through the intended
bearing layers to possibly much greater
depths (Figure 5). These eventually gain
capacity as friction piles or encounter a
TECHNICAL
Figure 4. Histograms of tip elevation for piles
bearing in competent limestone at Piers 2-E,
9-W, 15-W, 17-W and 30-E.
Figure 5. Histograms of pile-tip elevation for
piles that punch through their bearing layer and
for piles that encounter karst features.
Group II Piles punching through the
intended bearing layers, which eventually
gain capacity as friction piles or encounter
a deeper hard limestone layer
Group III Piles hitting karst or other
anomalous features to develop design
capacity at great depth or not at all
This grouping was made for compatibility
with the predictive statistical model
discussed later.
The pile installation records (Figure 1)
suggest there is some east-west trend to
the geological conditions under the bridge;
however, local variation is significant. For
106 | ISSUE 3 2020 www.piledrivers.org
/www.hartmanengineering.com
/www.vulcanhammer.com
/www.piledrivers.org