FEATURE
not control design, so mat thickness was not reduced with decreasing
allowable loads. Mat stiffness was required to deliver load to the
piles farther out from the core walls via mat flexure.
Representative unit concrete placement costs of $565 and $335
per cubic yard was used for pile cap concrete and core mat concrete,
respectively. These costs included excavation, shoring, reinforcing
steel, concrete placement and stripping. A summary of pile cap and
core mat concrete volume, total concrete volume and concrete cost
for the various designs is presented in Tables 1a and 1b.
As would be expected, total concrete volume and cost
increased with decreasing allowable loads. A review of Tables
1a and 1b indicates that the difference between the design scenarios
using the highest allowable load with set-up and the lowest
allowable load without set-up amounted to 1,995 cubic yards
of concrete. This results in an extra concrete cost of $935,125
($1,663,925 versus $728,800).
Construction-control method costs
Based on actual costs incurred for the test program, costs associated
with the various CCMs and components were estimated.
Costs incurred by the contractor, the dynamic testing agency and
the geotechnical engineer were included. Distinction was made
between dynamic load testing during installation (performed for
designs both with and without set-up) and during restrike testing
(performed only for designs with set-up). Distinction was also
made between a static load test instrumented to provide loadtransfer
behavior (performed for designs with set-up) and a noninstrumented
static load test (performed for designs without setup).
A summary of CCM costs for the various designs is presented
in Tables 1a and 1b.
As would be expected, construction-control method costs
increased with increasing allowable loads and CCMs which included
field characterization of set-up were more expensive than those
that did not characterize set-up. A review of Tables 1a and 1b indicates
that the CCM cost difference between the design scenarios
using the highest allowable load with set-up and the lowest allowable
load without set-up was $235,760.
Nine of the 10 test piles were installed in production-pile locations.
Based on the production piles’ average embedded length and
unit installation cost, installing nine test piles in production-pile
locations reduced the project’s net test program cost by approximately
$28,000.
Total foundation costs
For each of the design scenarios and their associated allowable pile
loads, total foundation cost was determined by adding the pile,
concrete and construction-control method costs together. The
resulting total foundations costs are presented in Tables 1a and 1b.
A review of Tables 1a and 1b indicates that the total cost difference
between the design scenarios using the highest allowable load
with set-up and the lowest allowable load without set-up results in
a total foundation cost savings of $3,300,912 ($2,513,762 versus
$5,814,673, a factor of 2.3).
Despite increased CCM costs associated with higher allowable
loads, whether incorporating set-up or not, total foundation
costs decreased with increasing allowable loads. Similarly, despite
increased CCM costs associated with characterizing set-up for
a given safety factor, total foundation costs decreased when setup
was incorporated in design. In other words, whether testing
resulted in using a lower safety factor or in incorporating set-up,
the savings resulting from increased testing far exceeded the cost
of the testing.
The relationships between pile cost, concrete cost and the sum
of the two versus allowable load are presented in Figure 1. A review
of Figure 1 indicates that the piles account for approximately 65 to
70 percent of the constructed foundation cost. A review of Figure
1 also indicates that a given increase in allowable pile load from a
lower value results in greater cost savings than a given increase in
allowable load from a higher value. For example, greater savings
are realized by increasing the allowable load from 250 to 350 kips
than from 500 to 600 kips, an allowable load increase of 100 kips
in both cases. This is because at higher allowable loads, a reduction
in pile count at a given cap is less sensitive to an increase in allowable
load. Additionally, at higher allowable loads, more pile caps are
more likely to already contain the minimum required number of
piles (from a structural design standpoint) and still-higher allowable
loads do not result in fewer piles in those caps.
Schedule comparison
Evaluation of potential construction-control method scenarios
needs to include not only economic aspects, but also construction
schedule impacts (which have economic aspects because time is
money). Projects often have a direct correlation between economics
and the construction schedule, such as facilities that generate daily
revenue when brought into service. Less apparent economic aspects
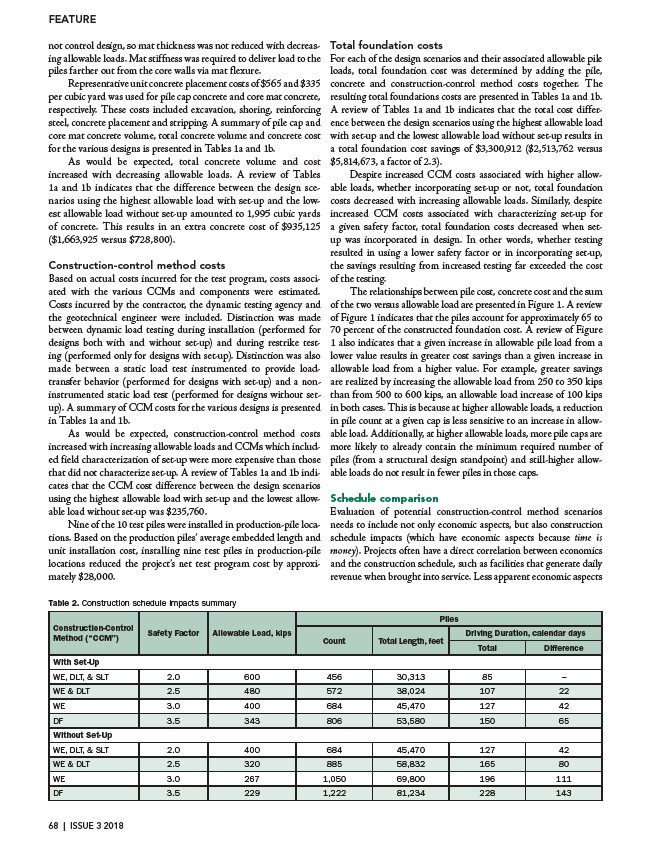
Table 2. Construction schedule impacts summary
Construction-Control
Method (“CCM”)
Safety Factor Allowable Load, kips
Piles
Count Total Length, feet
Driving Duration, calendar days
Total Difference
With Set-Up
WE, DLT, & SLT 2.0 600 456 30,313 85 –
WE & DLT 2.5 480 572 38,024 107 22
WE 3.0 400 684 45,470 127 42
DF 3.5 343 806 53,580 150 65
Without Set-Up
WE, DLT, & SLT 2.0 400 684 45,470 127 42
WE & DLT 2.5 320 885 58,832 165 80
WE 3.0 267 1,050 69,800 196 111
DF 3.5 229 1,222 81,234 228 143
68 | ISSUE 3 2018