FEATURE
from a drivability perspective using readily available equipment.
Ten test piles were installed, driven to near-maximum attainable
end-of-drive capacities. The piles were driven using a Delmag D46
32 single-acting diesel hammer.
To aid in demonstrating even higher capacities, soil set-up
was characterized utilizing relatively long-term restrikes (36 to
54 days after EOID) using an APPLE drop hammer. Set-up
characterization included determining both total set-up magnitude
and distribution along the shaft, allowing set-up to be
incorporated into production-pile driving criteria. Dynamic
monitoring using a Pile Driving Analyzer® (PDA) and subsequent
CAPWAP® analyses were performed on dynamic test
records from all the test piles’ installations and restrikes. Based
on test-program results, it was anticipated that production piles
could be driven to depths at which they would experience a minimum
set-up of 400 kips so that their long-term capacity would
equal or exceed 1,200 kips. Design and construction proceeded
using 600-kip allowable load piles.
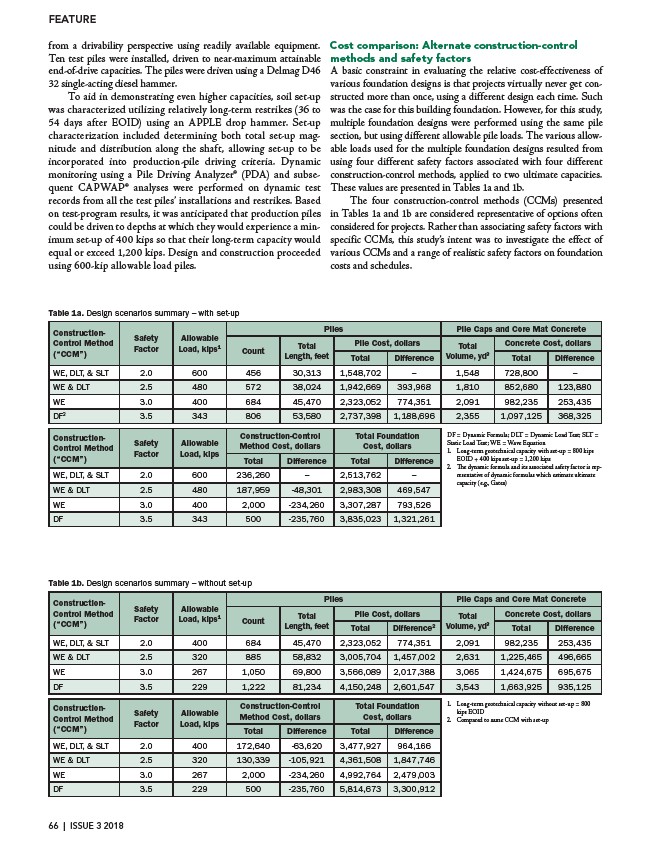
Cost comparison: Alternate construction-control
methods and safety factors
A basic constraint in evaluating the relative cost-effectiveness of
various foundation designs is that projects virtually never get constructed
more than once, using a different design each time. Such
was the case for this building foundation. However, for this study,
multiple foundation designs were performed using the same pile
section, but using different allowable pile loads. The various allowable
loads used for the multiple foundation designs resulted from
using four different safety factors associated with four different
construction-control methods, applied to two ultimate capacities.
These values are presented in Tables 1a and 1b.
The four construction-control methods (CCMs) presented
in Tables 1a and 1b are considered representative of options often
considered for projects. Rather than associating safety factors with
specific CCMs, this study’s intent was to investigate the effect of
various CCMs and a range of realistic safety factors on foundation
costs and schedules.
Table 1a. Design scenarios summary – with set-up
Construction-
Control Method
(“CCM”)
Safety
Factor
Allowable
Load, kips1
Piles Pile Caps and Core Mat Concrete
Count
Total
Length, feet
Pile Cost, dollars Total
Volume, yd3
Concrete Cost, dollars
Total Difference Total Difference
WE, DLT, & SLT 2.0 600 456 30,313 1,548,702 – 1,548 728,800 –
WE & DLT 2.5 480 572 38,024 1,942,669 393,968 1,810 852,680 123,880
WE 3.0 400 684 45,470 2,323,052 774,351 2,091 982,235 253,435
DF2 3.5 343 806 53,580 2,737,398 1,188,696 2,355 1,097,125 368,325
Construction-
Control Method
(“CCM”)
Safety
Factor
Allowable
Load, kips
Construction-Control
Method Cost, dollars
Total Foundation
Cost, dollars
Total Difference Total Difference
WE, DLT, & SLT 2.0 600 236,260 – 2,513,762 –
WE & DLT 2.5 480 187,959 -48,301 2,983,308 469,547
WE 3.0 400 2,000 -234,260 3,307,287 793,526
DF 3.5 343 500 -235,760 3,835,023 1,321,261
DF = Dynamic Formula; DLT = Dynamic Load Test; SLT =
Static Load Test; WE = Wave Equation
1. Long-term geotechnical capacity with set-up = 800 kips
EOID + 400 kips set-up = 1,200 kips
2. The dynamic formula and its associated safety factor is representative
of dynamic formulas which estimate ultimate
capacity (e.g., Gates)
Table 1b. Design scenarios summary – without set-up
Construction-
Control Method
(“CCM”)
Safety
Factor
Allowable
Load, kips1
Piles Pile Caps and Core Mat Concrete
Count
Total
Length, feet
Pile Cost, dollars Total
Volume, yd3
Concrete Cost, dollars
Total Difference2 Total Difference
WE, DLT, & SLT 2.0 400 684 45,470 2,323,052 774,351 2,091 982,235 253,435
WE & DLT 2.5 320 885 58,832 3,005,704 1,457,002 2,631 1,225,465 496,665
WE 3.0 267 1,050 69,800 3,566,089 2,017,388 3,065 1,424,675 695,675
DF 3.5 229 1,222 81,234 4,150,248 2,601,547 3,543 1,663,925 935,125
Construction-
Control Method
(“CCM”)
Safety
Factor
Allowable
Load, kips
Construction-Control
Method Cost, dollars
Total Foundation
Cost, dollars
Total Difference Total Difference
WE, DLT, & SLT 2.0 400 172,640 -63,620 3,477,927 964,166
WE & DLT 2.5 320 130,339 -105,921 4,361,508 1,847,746
WE 3.0 267 2,000 -234,260 4,992,764 2,479,003
DF 3.5 229 500 -235,760 5,814,673 3,300,912
1. Long-term geotechnical capacity without set-up = 800
kips EOID
2. Compared to same CCM with set-up
66 | ISSUE 3 2018